Editor’s Note: This article was originally published here, on the GTmetrix blog.
It’s no secret that site speed is a ranking factor when it comes to on-page SEO.
As a search engine optimization company, it stands to reason we would have our own SEO in mind before undertaking any big projects on our website. So, when we decided to revamp our website in 2015, we knew that we were going to see a negative impact on our site performance overall.
Our new site was going to be significantly heavier with regard to Javascript and CSS. What we didn’t know was how much GTmetrix would help us get our site speed under control after the dust settled.
By leveraging a GTmetrix PRO membership, I was able to quarterback the project from start to finish despite being a relative neophyte on more technical issues. It all started with getting a firm understanding of why our site was slow in the first place; Nothing some thorough research couldn’t fix.
These days, I’m actually managing site speed overhauls for a number of clients! Put simply, this wouldn’t be possible without some of the additional features found in the GTmetrix PRO plans. I’m specifically referring to unlimited report filters and the ability to automatically monitor more than 3 URLs concurrently.
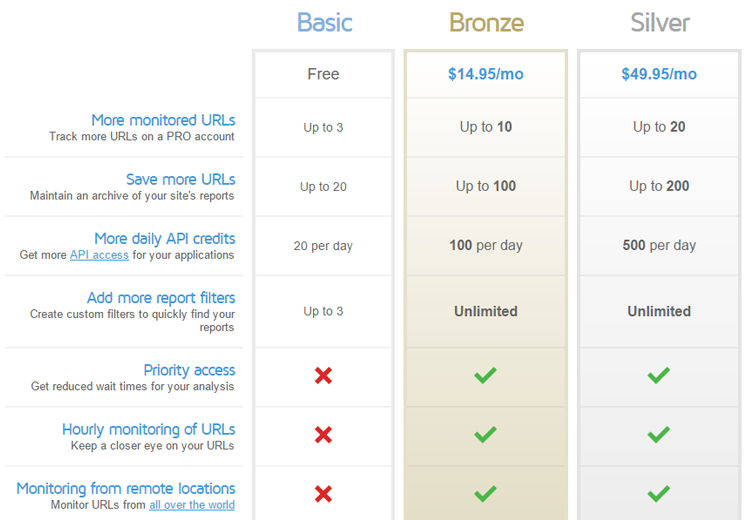
GTmetrix PRO plan options
Anyways, the ability to view earlier reports both on a graph and in detailed breakdowns proved invaluable for our RankPay project. By utilizing the monitoring and history feature, I was able to observe specifically what we changed and what impact those changes had on our performance in near real-time.
I’ll cover the specifics below, but the short version is this: we more than halved our page load times. Here’s our site speed case study using GTMetrix!
Why Site Speed Matters to RankPay
For those that don’t know already, site speed is a legitimate ranking factor. Matt Cutts first formally confirmed it all the way back in 2010.
Matt’s statements make it seem fairly unimportant in the big scheme of things, but in the subsequent years it’s become increasingly apparent that it carries more weight now than ever. And that makes sense when you think about it.
…40% of users will bounce out of a page if it takes longer than 3 seconds to load. Share on XGoogle wants to reward sites that are useful, relevant, and provide good experiences for visitors. Having a page load quickly, is really nice for visitors. It’s also really nice for businesses since data suggests up to 40% of users will bounce out of a page if it takes longer than 3 seconds to load. Are you one of that 40%? I know I am!
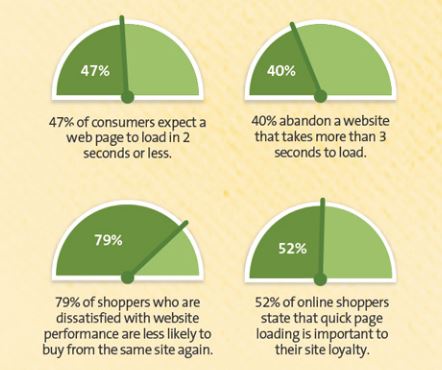
Image courtesy of Kissmetrics
Further, Moz’s 2015 ranking factor study showed “page loading time” scoring a 6.6/10 in the “page-level keyword agnostic” category of ranking factors. That’s nothing to shake a stick at. The verdict is in and page load time as a ranking factor is here to stay.
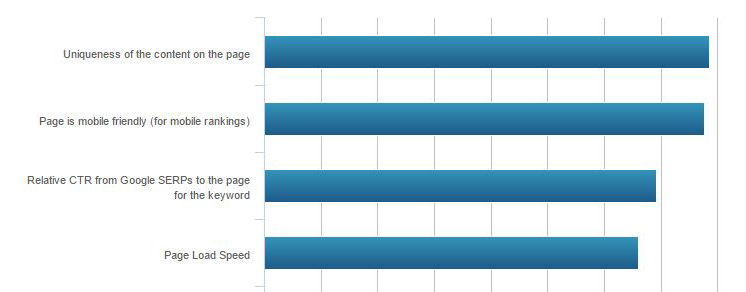
Page Load Speed is among the top ranking factors
In short, SEO and UX are becoming increasingly intertwined as Google gets better at monitoring more complex and qualitative data sets.
It should come as no surprise then that site speed has never been far from our minds here at RankPay. We pride ourselves on a smooth user experience and simultaneously rely on SEO and strong organic rankings for a good chunk of our lead generation.
Hence we decided to revamp our website in 2015 to improve user experience and implement some new marketing tools. The project was a huge success and we saw immediately saw measurable improvement across the board. That is, except for load times.
To be specific, it suffered quite a bit. We ended up somewhere around a 5 second page load time, as opposed to 2.5 seconds on our earlier site.

GTmetrix Performance and Page Details
When we started our journey to solve this problem, I took the helm. Truth be told I was a bit green with regard to improving site speed. I knew I’d need to do a substantial amount of research.
Fortunately, I was referred to GTmetrix early on. From there on in, my job got a lot easier.
Leveraging GTmetrix reports
When I ran my first report on GTmetrix, I was admittedly overwhelmed by some of the data. Some of it was too technical for me to immediately grasp.
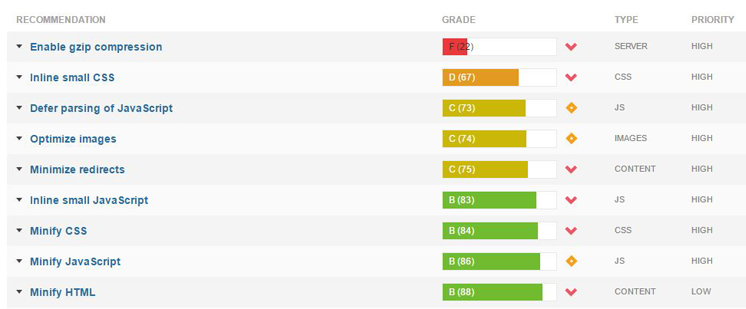
GTmetrix recommendations
The above is maybe 1/10th of the total information provided in each report.
But the tooltips and “additional reading” materials provided on the various subsections kept me on course. I was able to quickly get a working understanding of the specific problem areas we faced, and how to communicate about them effectively with our development team.
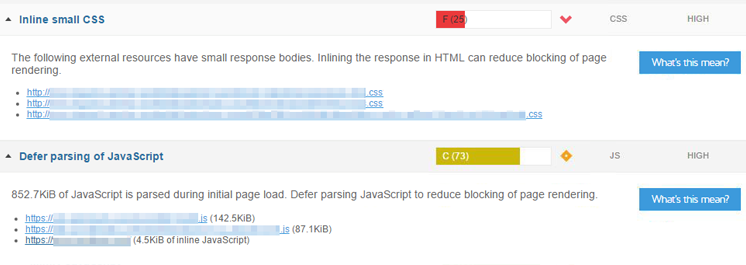
Recommendations expanded – hover over “What’s this mean?” to get more information
Moving on, we found the following issues with our site’s optimization for speed:
- Too many separate Javascript and CSS resources.
- Slow TTFB
- Imperfect caching
- A few unoptimized images
- Redundant analytics resources
- Unused plugins being called by browsers
We had our work cut out for us!
I got down to business consulting with our developers and we quickly developed a plan of attack. The specifics of which, are a story for another day. But you can get a feel for some of the techniques in my beginner’s guide to understanding and improving site speed.
Staying on Track with GTmetrix Comparisons and Digests
While I worked with our development team, it was incredibly useful for us to use GTmetrix reports as the primary basis to analyze the impact of our efforts.
When all was said and done, we had improved our PageSpeed and YSlow scores by ~20% each! Share on XWe would frequently run a report, implement a plug-in change, and then run another report. We could then use the report comparison tool within GTmetrix to measure what impact our most recent changes had on load times.
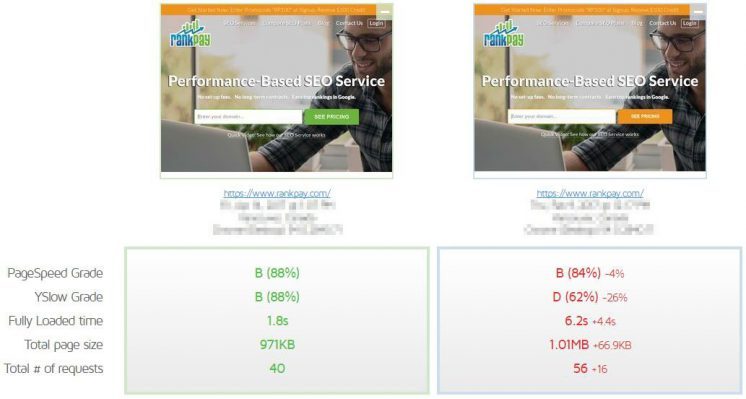
GTmetrix comparison feature
We went on to use this very same methodology to check the effectiveness of our CSS and JS concatenation efforts, caching tweaks, and server-side TTFB improvements.
When all was said and done, we had improved our PageSpeed and YSlow scores by ~20% each!
Nowadays, even though the vast majority of our work is done, the weekly automated reports continue to be valuable to me and our development team.
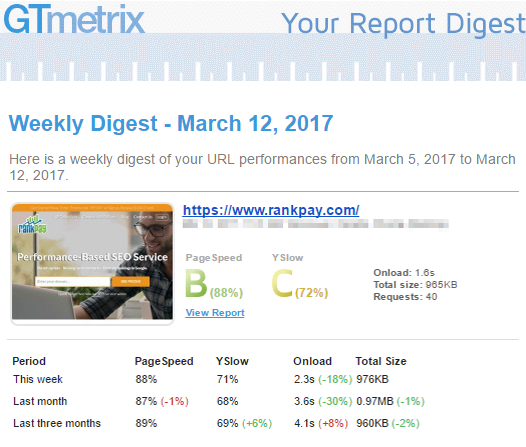
A digest of reports gets emailed to you every week
Since we are continually optimizing and tweaking our site, keeping tabs on any slips in site speed is important. Every now and then I’ll implement a new marketing tool and find that it has an unreasonably high impact on our performance.
While the decision about whether the pros of site changes outweigh the cons isn’t always clear-cut, being well-equipped with complete information is invaluable when it comes to making an informed choice.
Summary of Improvements
So I know what you’re wondering… net net, what were the improvements we accomplished?
I’m happy to report that we were able to find the bottlenecks and reduce our site load times from ~5 seconds to ~1.8 seconds.
It was such a dramatic improvement that we still occasionally get comments from customers about how much snappier our website feels.
Now, it’s important to note that not every site speed project will yield such significant results. Often customers may not subjectively notice the difference, but you can bet that Google’s crawlers will.
Now, we’re always optimizing many aspects of our digital presence, so it’s impossible to attribute the following benefits to site speed improvement alone. But we have strong observational evidence to believe that our site speed improvements have strongly contributed to the following:
- 20% reduction in bounce-rate
- 3.5 second reduction in home-page load time
- ~10% increase in overall organic presence
- Noticeably faster site experience for new and especially returning users
How Can You Get Your Own Project Started?
If you’re not an experienced developer, site speed can be a daunting task to undertake.
There’s a lot of jargon, a lot of data to analyze, and not all solutions will be feasibly implemented without a skilled back-end developer on hand.
That being said, it’s worth the time and effort, and GTmetrix can make the process a whole lot easier.
It was a critical tool in my arsenal that allowed me to both learn the ropes and get my hands dirty improving both the SEO and UX of our new site. Two birds with one stone! I’d heartily encourage every site owner to at least consider taking a look at this opportunity to improve your website and impress visitors and Google alike.


